Observability Part 5 of 5 · Platform Engineering
Kubernetes Observability with Prometheus, Grafana and Loki
kube-prometheus-stack, Loki in single-binary mode and Alloy on a kind cluster; the PromQL and LogQL that answer operational questions; low-cardinality log labels; a real OOM restart loop diagnosed end to end.
- Author
- Sachin Chaurasiya
- Published
- Reading time
- 21 min read
- Difficulty
- intermediate

On this page
Overview
A cluster without metrics and logs can only be operated by kubectl describe, one pod at a time, after someone
has noticed. The stack below is the common baseline: Prometheus for metrics and alert rules, Loki for logs,
Grafana to query both, installed with Helm on a disposable kind cluster. The second half is the reason to have
it: a Deployment that is killed every couple of minutes, and the sequence of questions that finds out why
without guessing.
Everything was executed on a three-node kind 0.31 cluster (Kubernetes 1.35) on a laptop, with the chart versions in the header. The numbers and screenshots are from that run. Two things are configuration only and are marked where they appear: an Alertmanager receiver that notifies a real channel, and object storage for Loki.
- The kubelet and cAdvisor on each node expose container CPU, memory and network as
container_*metrics. Prometheus scrapes them through the API server proxy; no agent is needed for this layer. - kube-state-metrics turns Kubernetes objects into metrics: restart counts, available replicas, termination
reasons, resource requests and limits. It is what makes “how many restarts” a query rather than a
kubectlloop. - Alloy runs as a DaemonSet, discovers the pods on its node, tails their log files under
/var/log/pods, attaches a small set of labels and pushes to Loki. - Prometheus stores the metrics (two days of retention here) and evaluates alert rules every thirty seconds.
- Alertmanager receives the alerts, groups and routes them. The chart’s default route sends everything to a
receiver named
null, which is the first thing to change and the one thing this article does not. - Loki stores log chunks on the filesystem in single-binary mode: one pod, one volume, no object store, which is enough for a lab and a small cluster and not for anything with more than one Loki replica.
- Grafana has both as data sources, the chart’s dashboards, and one dashboard added here that puts a workload’s restarts, memory, CPU, termination reason and logs on one screen.
Install
Prerequisites
- A disposable cluster:
kind create cluster --config kind.yamlwith one control plane and two workers - Helm 4.x and the
prometheus-communityandgrafanachart repositories - About 2 GB of image pulls on first install; on a slow connection budget twenty minutes
- A workload to watch: this article uses the
ci-demoimage from the CI/CD Engineering path
Metrics
grafana:
  adminPassword: lab-admin-password # lab only; a Secret in production
  additionalDataSources:
    - name: Loki
      type: loki
      uid: loki
      url: http://loki.monitoring.svc.cluster.local:3100
      access: proxy
prometheus:
  prometheusSpec:
    retention: 2d
    resources:
      requests: { cpu: 200m, memory: 512Mi }
    # Pick up ServiceMonitors, PodMonitors and PrometheusRules from every namespace, not only the release's.
    serviceMonitorSelectorNilUsesHelmValues: false
    podMonitorSelectorNilUsesHelmValues: false
    ruleSelectorNilUsesHelmValues: false
# kind does not expose these control-plane endpoints on the node IP; disabling them avoids permanent "down" targets.
kubeEtcd: { enabled: false }
kubeControllerManager: { enabled: false }
kubeScheduler: { enabled: false }
kubeProxy: { enabled: false }
helm repo add prometheus-community https://prometheus-community.github.io/helm-charts
helm repo add grafana https://grafana.github.io/helm-charts
kubectl create namespace monitoring
helm install kps prometheus-community/kube-prometheus-stack --version 91.4.1 -n monitoring -f kps-values.yamlThe three *SelectorNilUsesHelmValues: false lines are the ones people miss. By default the operator only
picks up ServiceMonitor and PrometheusRule objects labelled with the release name; with them set to false
any team can add a rule or a scrape target in its own namespace, which is the point of running an operator.
Logs
deploymentMode: SingleBinary
loki:
  auth_enabled: false
  commonConfig: { replication_factor: 1 }
  storage: { type: filesystem }
  schemaConfig:
    configs:
      - from: '2024-04-01'
        store: tsdb
        object_store: filesystem
        schema: v13
        index: { prefix: loki_index_, period: 24h }
  limits_config: { retention_period: 48h }
singleBinary:
  replicas: 1
  persistence: { enabled: true, size: 5Gi }
backend: { replicas: 0 }
read: { replicas: 0 }
write: { replicas: 0 }
chunksCache: { enabled: false }
resultsCache: { enabled: false }
gateway: { enabled: false }
lokiCanary: { enabled: false }
test: { enabled: false }
monitoring:
  selfMonitoring: { enabled: false }
  serviceMonitor: { enabled: true }
helm install loki grafana/loki --version 7.3.0 -n monitoring -f loki-values.yamlThe chart defaults to the scalable mode with object storage and caches; every replicas: 0 and
enabled: false above turns one of those off. The serviceMonitor stays on so Prometheus scrapes Loki, which
matters later when Loki itself is the thing that is slow.
Alloy collects the logs. The configuration is the part worth reading, because it decides the labels every log line will carry for as long as it is stored:
controller:
  type: daemonset
alloy:
  configMap:
    content: |
      discovery.kubernetes "pods" {
        role = "pod"
      }

      discovery.relabel "pods" {
        targets = discovery.kubernetes.pods.targets
        // Only pods on this node: each Alloy instance reads its own node's files.
        rule {
          source_labels = ["__meta_kubernetes_pod_node_name"]
          regex         = sys.env("HOSTNAME_NODE")
          action        = "keep"
        }
        rule {
          source_labels = ["__meta_kubernetes_namespace"]
          target_label  = "namespace"
        }
        rule {
          source_labels = ["__meta_kubernetes_pod_name"]
          target_label  = "pod"
        }
        rule {
          source_labels = ["__meta_kubernetes_pod_container_name"]
          target_label  = "container"
        }
        rule {
          source_labels = ["__meta_kubernetes_pod_label_app"]
          target_label  = "app"
        }
        rule {
          source_labels = ["__meta_kubernetes_pod_uid", "__meta_kubernetes_pod_container_name"]
          separator     = "/"
          target_label  = "__path__"
          replacement   = "/var/log/pods/*$1/*.log"
        }
      }

      local.file_match "pods" {
        path_targets = discovery.relabel.pods.output
      }

      loki.source.file "pods" {
        targets    = local.file_match.pods.targets
        forward_to = [loki.process.pods.receiver]
      }

      loki.process "pods" {
        // containerd log lines are "<ts> <stream> <flags> <message>"; strip the prefix.
        stage.cri {}
        // The file path changes on every container restart (0.log, 1.log, ...): as a label it
        // would open a new stream per restart. Drop it; the pod and container labels are enough.
        stage.label_drop {
          values = ["filename"]
        }
        forward_to = [loki.write.default.receiver]
      }

      loki.write "default" {
        endpoint {
          url = "http://loki.monitoring.svc.cluster.local:3100/loki/api/v1/push"
        }
      }
  extraEnv:
    - name: HOSTNAME_NODE
      valueFrom: { fieldRef: { fieldPath: spec.nodeName } }
  mounts:
    varlog: true
  securityContext:
    runAsUser: 0
helm install alloy grafana/alloy --version 1.12.1 -n monitoring -f alloy-values.yamlThe first version of this file crashed Alloy on start with expected TERMINATOR, got ILLEGAL: Alloy’s
configuration language does not accept ; to put two attributes on one line, and the error points at the exact
column. The second version ran without the label_drop stage, and the section on cardinality below shows what
that cost.
Two Alloy pods came up, not three: the control-plane node carries a NoSchedule taint and the chart adds no
toleration by default. On a real cluster the control plane’s logs are usually collected differently anyway; on
kind, add the toleration if you want them.
Metrics
What Prometheus is scraping
kubectl -n monitoring port-forward svc/kps-kube-prometheus-stack-prometheus 9091:9090
curl -s http://127.0.0.1:9091/api/v1/targets | jq -r '.data.activeTargets[] | "\(.health) \(.labels.job)"' | sort | uniq -c
1 up apiserver
2 up coredns
1 up kps-grafana
2 up kps-kube-prometheus-stack-alertmanager
1 up kps-kube-prometheus-stack-operator
2 up kps-kube-prometheus-stack-prometheus
1 up kube-state-metrics
9 up kubelet
1 up monitoring/loki
3 up node-exporterTwenty-three targets and 76,000 active series on an otherwise idle three-node cluster. The three largest metric families by series count were all API server request histograms:
apiserver_request_body_size_bytes_bucket      4992
apiserver_request_duration_seconds_bucket     4240
apiserver_request_sli_duration_seconds_bucket 2720
On a larger cluster those are the first candidates for a metricRelabelings drop.
Earlier in the run the same listing showed kube-state-metrics and the operator as down. Both were being
killed by their own liveness probes while the API server was slow, and every kube_* query returned empty until
they recovered. When a query about pods returns nothing, check the kube-state-metrics target before checking
the pods.
The queries that answer operational questions
Each of these was run against the cluster while the failure in the next section was in progress. Restarts, from kube-state-metrics:
increase(kube_pod_container_status_restarts_total{namespace="shop"}[15m])pod=checkout-6bc9d49cf6-mqx2p container=app -> 0
pod=checkout-6bc9d49cf6-tjpbs container=app -> 0
pod=checkout-68b8d4b55d-4gb4w container=app -> 3.16Why the last one restarted, also from kube-state-metrics:
kube_pod_container_status_last_terminated_reason{namespace="shop"} == 1pod=checkout-68b8d4b55d-4gb4w container=app reason=OOMKilled -> 1How close each container is to its memory limit, joining cAdvisor’s working set with the limit from kube-state-metrics:
max by (namespace, pod, container) (container_memory_working_set_bytes{namespace="shop", container!="", container!="POD"})
  / on (namespace, pod, container)
max by (namespace, pod, container) (kube_pod_container_resource_limits{namespace="shop", resource="memory"})
pod=checkout-6bc9d49cf6-mqx2p container=app -> 0.71
pod=checkout-6bc9d49cf6-tjpbs container=app -> 0.46
pod=checkout-68b8d4b55d-4gb4w container=app -> 0.91The max by matters: cAdvisor reports the working set with an id and an instance label that differ between
scrapes of the same container after a restart, and without the aggregation the division has nothing to match
on. container!="" and container!="POD" drop the pod-level cgroup and the pause container, which otherwise
appear as extra series with no limit.
CPU, which turned out to be the most revealing signal:
sum by (pod) (rate(container_cpu_usage_seconds_total{namespace="shop", container="app"}[5m]))pod=checkout-6bc9d49cf6-mqx2p -> 0.008
pod=checkout-6bc9d49cf6-tjpbs -> 0.066
pod=checkout-68b8d4b55d-4gb4w -> 0.529Half a core, for a process that does nothing but answer a health check. That is a Node.js process running garbage collection continuously at 91 % of a memory limit it cannot fit in, and it is the difference between “the pod restarts” and “the pod is dying slowly before every restart”.
Requests as a fraction of the cluster, which is the capacity question:
sum(kube_pod_container_resource_requests{resource="cpu"}) / sum(kube_node_status_allocatable{resource="cpu"})Alert rules through the operator
Rules are PrometheusRule objects; the operator hands them to Prometheus and reports whether they parsed:
apiVersion: monitoring.coreos.com/v1
kind: PrometheusRule
metadata:
  name: workload-signals
  namespace: monitoring
  labels: { release: kps }
spec:
  groups:
    - name: workload-signals
      rules:
        - alert: WorkloadMemoryNearLimit
          expr: |
            max by (namespace, pod, container) (container_memory_working_set_bytes{container!="", container!="POD"})
              / on (namespace, pod, container)
            max by (namespace, pod, container) (kube_pod_container_resource_limits{resource="memory"})
              > 0.9
          for: 5m
          labels: { severity: warning }
          annotations:
            summary: '{{ $labels.namespace }}/{{ $labels.pod }} ({{ $labels.container }}) is at {{ $value | humanizePercentage }} of its memory limit'
        - alert: WorkloadOOMKilled
          expr: |
            max by (namespace, pod, container) (kube_pod_container_status_last_terminated_reason{reason="OOMKilled"}) == 1
              and on (namespace, pod, container)
            increase(kube_pod_container_status_restarts_total[30m]) > 2
          for: 1m
          labels: { severity: warning }
          annotations:
            summary: '{{ $labels.namespace }}/{{ $labels.pod }} ({{ $labels.container }}) was OOM-killed and is restarting'
kubectl apply -f workload-rules.yaml
curl -s http://127.0.0.1:9091/api/v1/rules | jq -r '.data.groups[] | select(.name|test("workload-signals")) | .rules[] | "\(.name) \(.state) \(.health)"'WorkloadMemoryNearLimit inactive ok
WorkloadOOMKilled pending okForty-five seconds after kubectl apply, both rules were loaded (health ok) and the second was already
pending against the failing pod. promtool check rules is the pre-merge check for the same file; the operator’s
health field is the post-deploy one, and a rule with a PromQL error shows err there rather than silently
never firing. The chart also ships 136 alerting and 85 recording rules of its own; KubePodNotReady, KubePodCrashLooping and
KubeDeploymentRolloutStuck all appear in the next section without any configuration.
Logs
The collection path
A container writes to stdout; containerd writes it to a file on the node:
/var/log/pods/<namespace>_<pod>_<uid>/<container>/N.logN increments on every restart. Alloy on that node tails the file, attaches labels from the pod it discovered
through the API, strips the containerd prefix with stage.cri, and pushes batches to Loki. Loki indexes the
labels, not the text, and stores the text in compressed chunks.
kubectl -n monitoring port-forward svc/loki 3101:3100
curl -s -G http://127.0.0.1:3101/loki/api/v1/query_range \
  --data-urlencode 'query={namespace="shop", pod=~"checkout-68b8.*"}' --data-urlencode 'limit=10'
06:23:23 checkout-68b8d4b55d-4gb4w | ci-demo 1.4.0+4e205ab listening on 3000
06:22:08 checkout-68b8d4b55d-4gb4w | ci-demo 1.4.0+4e205ab listening on 3000Two lines, for a pod that by then had restarted three times: a start-up line on the first two attempts and
nothing after. That is the correct output. The later attempts were killed before the process reached its first
console.log, and kubectl logs for those containers was empty too. A log pipeline can only carry what the
process wrote; the absence, next to a restart count that keeps rising, is itself the diagnosis, and it is why
the logs panel has to sit beside the metrics panels rather than in a separate tool.
LogQL for the questions that logs answer well:
count_over_time({namespace="shop"} |= "listening on" [1h])                       # starts per stream
sum by (namespace) (count_over_time({namespace=~".+"} |~ "(?i)level=error" [1h]))  # error lines per namespace
{namespace="argocd"} 108
{namespace="monitoring"} 149The second query is a cheap cluster-wide anomaly detector: run it every day and the namespace whose number doubled is the one to look at.
Labels and cardinality
Loki’s cost model is streams: one unique label set is one stream, with its own chunks and index entries. The
labels above (namespace, pod, container, app) give one stream per container, which is the right
granularity. The first Alloy configuration kept a fifth label by accident:
curl -s http://127.0.0.1:3101/loki/api/v1/labels | jq -c .data["app","container","filename","namespace","pod","service_name","stream"]68 streams; with filename label: 68; distinct pods: 28
streams for the failing pod: 2filename is the log file path, and the path contains N.log. Every restart opened a new stream for the same
container, so a crash-looping pod would create a stream per restart, each with a handful of lines. The
stage.label_drop in the configuration above removes it; after the upgrade, the restarted healthy pods
appeared under their existing {namespace, pod, container} stream with no filename. service_name and
detected_level are added by Loki itself (from the app label and by inspecting the line) and are fine to keep.
The rule for anything that becomes a label: it must have a bounded set of values you can name. Namespace,
container, app, environment: yes. Pod name is borderline and accepted because pods are what you query by.
Request IDs, user IDs, trace IDs, file paths, timestamps: never; they belong in the line, where |= and
| json find them without a stream per value.
When Loki itself is slow
Twice during this run Alloy’s push metrics showed the other side of the stack under pressure:
loki_write_request_duration_seconds_count{status_code="204"} 559
loki_write_request_duration_seconds_count{status_code="500"} 4
loki_write_request_duration_seconds_count{status_code="-1"}  19   # timeouts
loki_write_batch_retries_total 23
loki_write_dropped_entries_total 0
Loki logged removing ingester failing healthcheck ... context deadline exceeded at the same time: the
single-binary pod was starved for disk I/O on the laptop while Prometheus, Grafana’s SQLite database and etcd
shared the same volume. Alloy retried and dropped nothing, which is the behaviour to verify on your own cluster
by reading exactly these counters. Production Loki runs on object storage with the ingester separated from the
querier, and that is the sizing decision this article deliberately did not make.
Grafana
The chart installs Grafana with Prometheus and Alertmanager as data sources and 25 dashboards; the Loki data
source came from additionalDataSources in the values. The dashboards to know first:
| Dashboard | Question it answers |
|---|---|
| Kubernetes / Compute Resources / Cluster | Is the cluster over-committed; which namespace uses what |
| Kubernetes / Compute Resources / Namespace (Pods) | Which pod in a namespace is the outlier |
| Kubernetes / Compute Resources / Pod | One pod’s CPU, throttling, memory and limits over time |
| Node Exporter / Nodes | Node CPU, memory, disk and network; the “is it the node” check |
| Kubernetes / Kubelet | Pod start latency, PLEG relist, runtime errors; the “is it the kubelet” check |
The gap in that set is a single screen for “this workload is unhealthy, why”: restarts, memory against limit,
CPU, the termination reason and the logs, filtered by namespace and pod. A dashboard for it is a JSON file in a
ConfigMap with the grafana_dashboard: "1" label; the chart’s sidecar imports it within a minute:
kubectl -n monitoring create configmap workload-triage-dashboard --from-file=workload-triage.json --dry-run=client -o yaml \
  | kubectl label --local -f - grafana_dashboard=1 -o yaml | kubectl apply -f -
The five panels use the queries from the metrics section (max by (pod, container) on every Prometheus target,
so a restarted container does not draw twice) and one Loki query, {namespace="$namespace", pod=~"$pod"}, with
the two variables driven by label_values(kube_pod_info, ...).
The failure, diagnosed
The workload is the ci-demo image behind a Service in a namespace called shop, two replicas, with a memory
limit of 24 MiB. It ran. Then the limit was lowered to 12 MiB in a rolling update, which is the shape of a real
incident: a resources change in a merge request that looked like a tidy-up.
resources:
  requests: { cpu: 25m, memory: 12Mi }
  limits: { memory: 12Mi }
What the cluster reported over the next hour, in the order an on-call engineer meets it:
The rollout stalled. The new ReplicaSet’s first pod never became ready, so the Deployment kept both old pods
and the rollout sat at one new pod, 0/1. No user-facing impact yet, which is why KubeDeploymentRolloutStuck
exists as a warning rather than a page.
Events showed the sequence per attempt: Started, then Readiness probe failed: connect: connection refused (the process had not started listening), then BackOff restarting failed container, and after a few
minutes Last State: Terminated, Reason: OOMKilled, Exit Code: 137, Restart Count: 8. Events are the first
place to look and the worst place to keep looking: they roll off after an hour and there is no history of the
count.
Metrics turned the events into a shape. Restarts climbed to 12; the working set sat at 91 % of the limit whenever the process was alive; CPU was fifty times the healthy replicas’. And the healthy replicas were not that healthy: the memory panel showed them creeping from 12 MiB towards 20 MiB over the hour and each was OOM-killed once at the 24 MiB limit. The change did not create the problem; it made a marginal limit an impossible one.
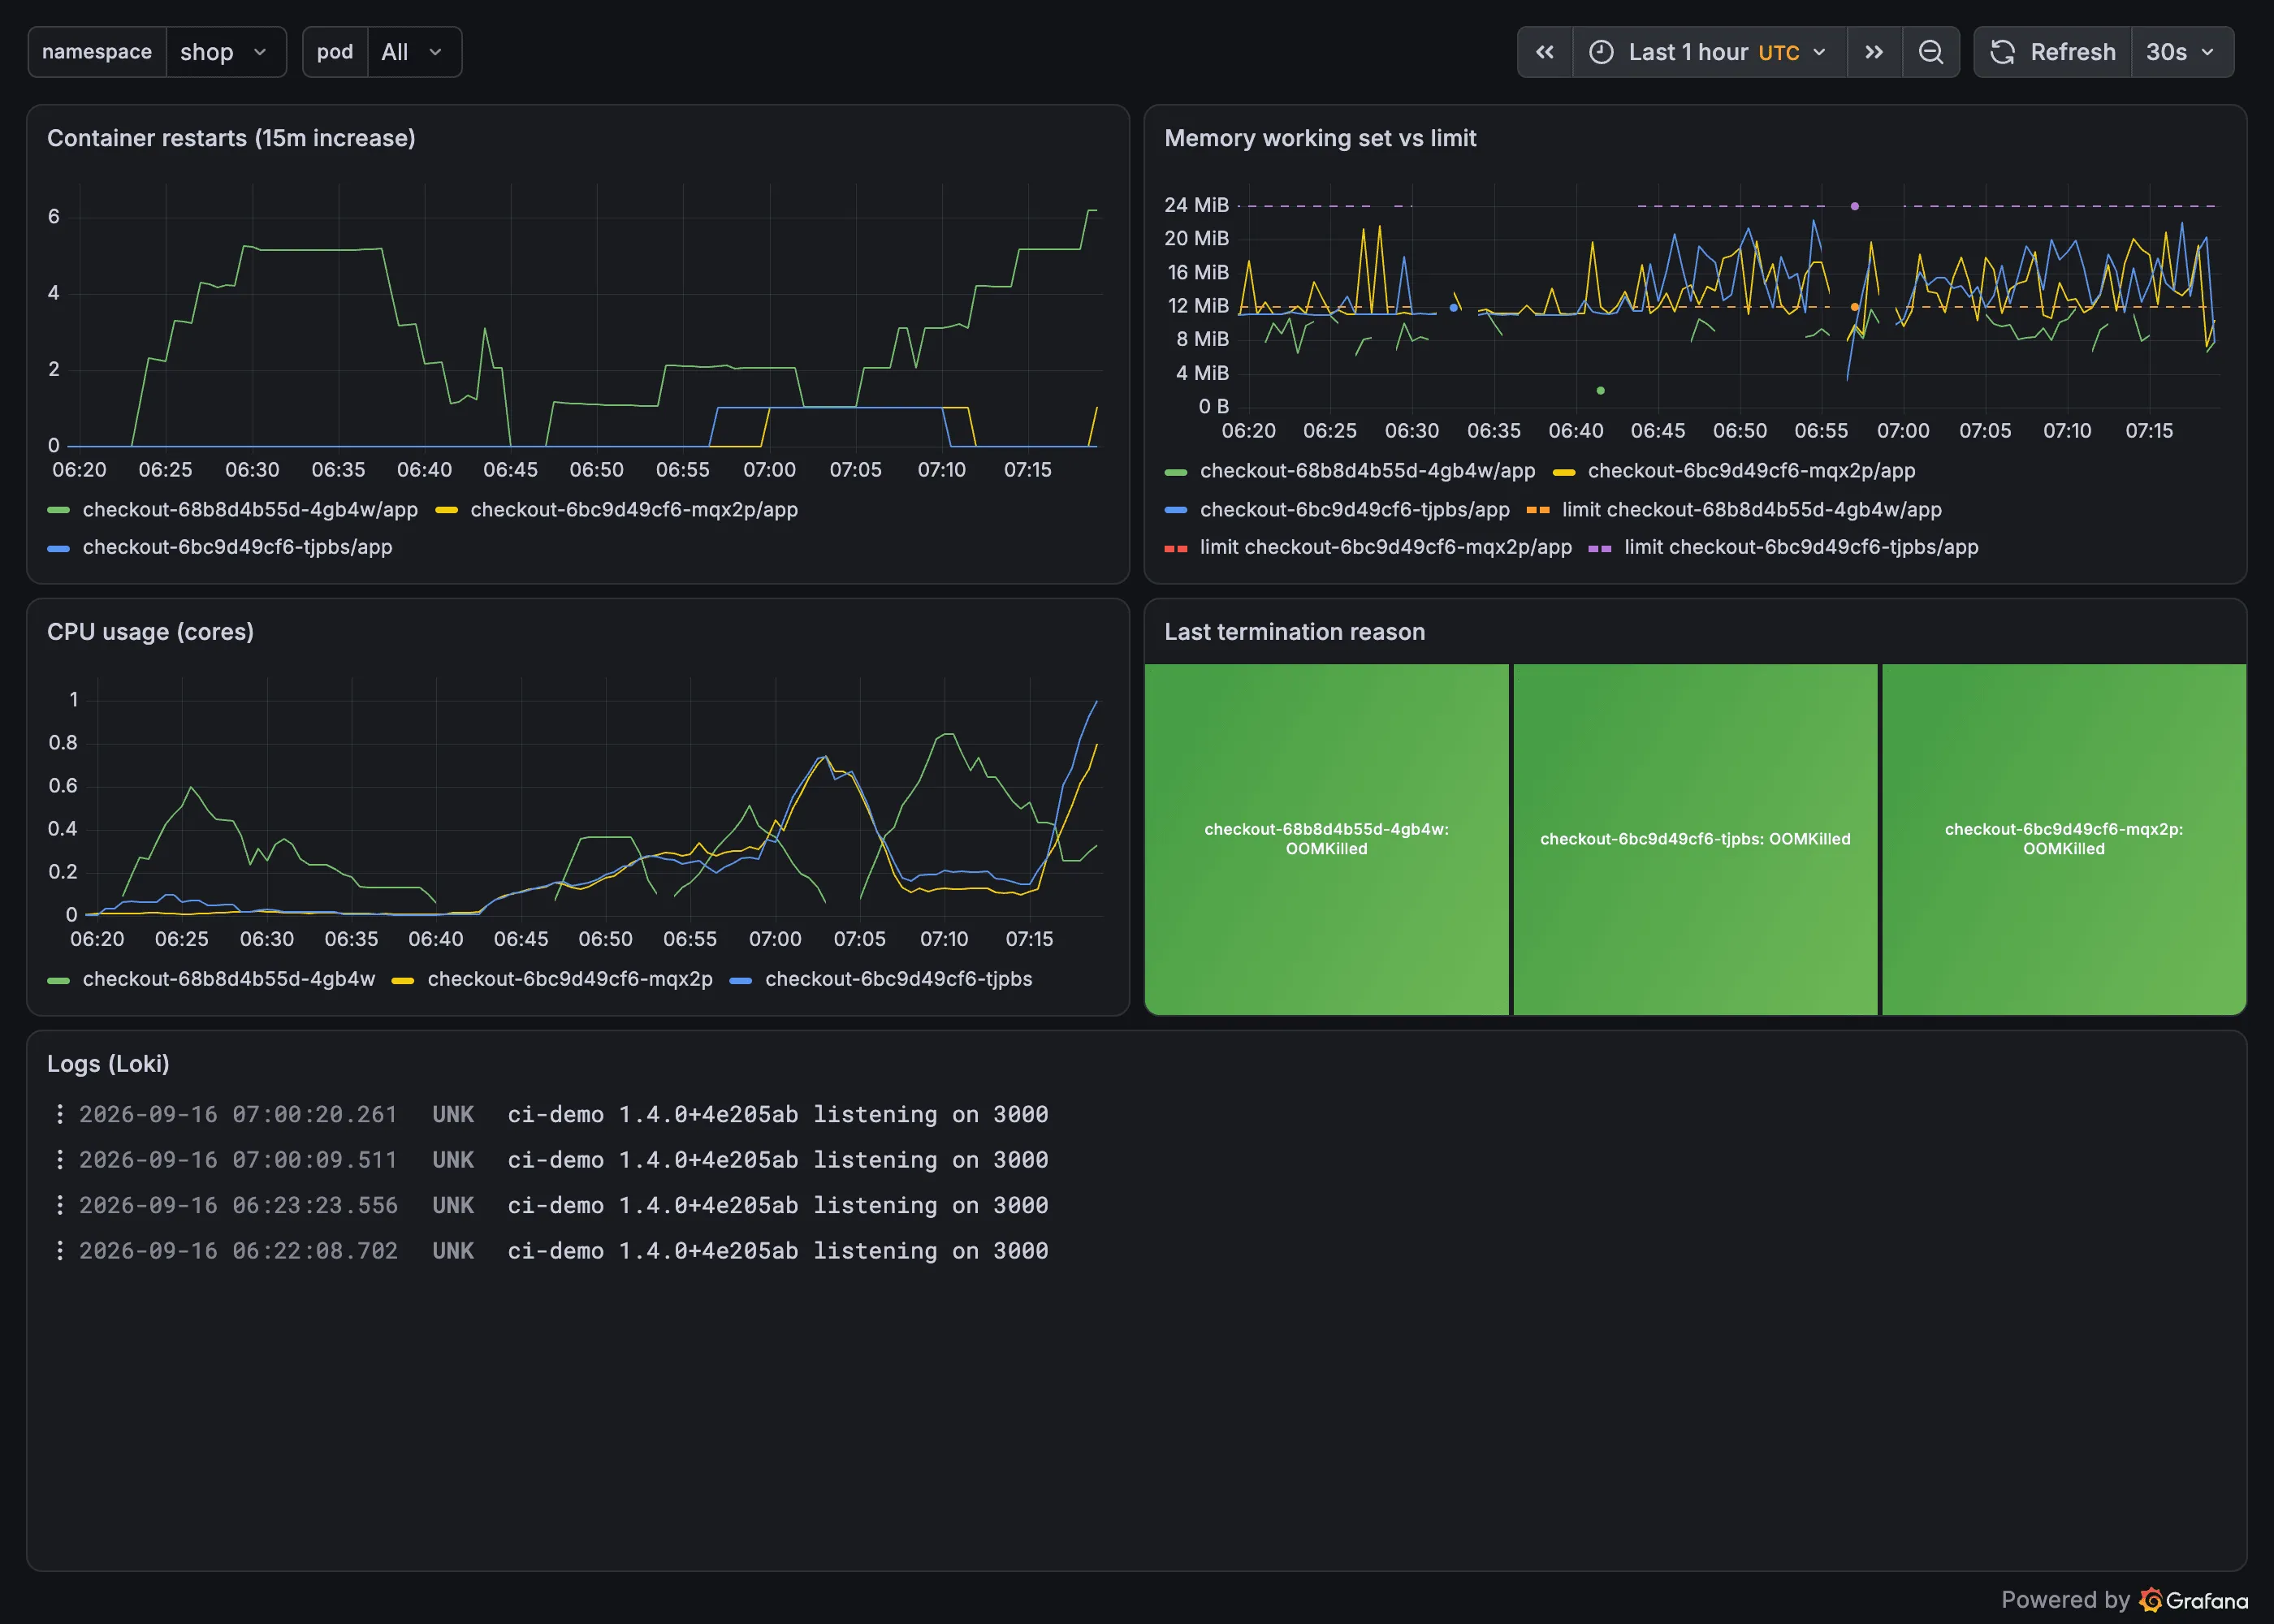
The workload-triage dashboard at 07:17 UTC, one hour into the failure: more than a dozen restarts on the new pod, every container’s last termination reason OOMKilled, and only four start-up lines in Loki for the whole namespace.
Logs said almost nothing, and that was informative: four listening on 3000 lines in an hour for a
namespace with three pods that had restarted more than fifteen times between them. The process was being killed before
it logged. A stack that only had logs would have shown an empty panel; a stack that only had metrics would have
shown restarts without the reason.
Alerts arrived in the order their for clauses allowed:
firing   WorkloadOOMKilled          since 07:09:55   shop/checkout-68b8d4b55d-4gb4w (app) was OOM-killed and is restarting
firing   KubePodNotReady            since 06:59:58   Pod has been in a non-ready state for more than 15 minutes.
pending  KubeDeploymentRolloutStuck since 07:13:28
pending  KubeDeploymentReplicasMismatch since 07:15:28
The custom WorkloadOOMKilled rule fired one minute after it was loaded, because its condition had already
been true for an hour. KubePodNotReady took its full fifteen minutes, and the chart’s KubePodCrashLooping
never made it: the pod alternated between Running, OOMKilled and CrashLoopBackOff fast enough that the
rule’s max_over_time(...[5m]) condition kept dropping out, and each drop reset the for timer. The same
reset happened to KubePodNotReady at 06:59 when kube-state-metrics was briefly down. A for clause is a
promise that the condition held continuously, and a scrape gap breaks it; that is an argument for short
for durations on high-signal rules and for alerting on the scrape target itself.
Alertmanager had both firing alerts and routed them to the receiver named null. That is the chart default and
it means nobody was told. Configuring a real receiver (Slack, PagerDuty, email) is a values change and was not
done here; the alerts are shown from Alertmanager’s API instead.
The fix was the limit that should have been reviewed in the first place:
resources:
  requests: { cpu: 25m, memory: 32Mi }
  limits: { memory: 64Mi }
Rollout complete in 98 seconds; the new pods settled at 17 % and 33 % of the limit with CPU at 0.015 cores; both firing alerts resolved within three minutes and Alertmanager showed none active. The 15-restart pod terminated with the old ReplicaSet.
The sequence generalises. Events for the immediate symptom, metrics for the shape and the reason, logs for what the process itself had to say, alerts to make sure the next one is noticed before an hour passes. Each layer was necessary here: the reason came from metrics, the “before every restart it thrashes” from CPU, the “logs are empty” from Loki, and the confirmation that the fix worked from all three together.
Security implications
- Grafana was installed with a values-file password and, for the captures, anonymous read access. Neither is acceptable beyond a lab: use an OIDC provider, keep anonymous off, and put the admin password in a Secret the chart references.
- Alloy runs as root with
/var/logmounted to read every container’s output on the node. Logs are data with the sensitivity of the most sensitive thing any application prints; Loki’s tenant model and Grafana’s data-source permissions decide who can read them, andauth_enabled: falsehere means everyone. - Prometheus scrapes the kubelet through the API server with the operator’s service account; the RBAC the chart creates is cluster-wide read. Review it before installing on a shared cluster.
- The provisioned dashboard was imported without Viewer permission in this Grafana version, so anonymous users
could not open it until a
builtInRoles/Viewerpermission was added through the API. The chart’s own dashboards had it. Check permissions on anything the sidecar imports if a role other than Admin needs to see it.
Troubleshooting
| Symptom | Cause | Fix |
|---|---|---|
Every kube_* query is empty | kube-state-metrics target down (liveness probe failed against a slow API server) | kubectl -n monitoring get pods; the target list names the endpoint and the error |
Alloy pod CrashLoopBackOff with expected TERMINATOR | Two attributes on one line separated by ; | One attribute per line; the error names the column |
| Only two Alloy pods on a three-node kind cluster | Control-plane taint, no toleration | Add a toleration in alloy.tolerations if control-plane logs are wanted |
| Streams multiply on every restart | filename kept as a label | stage.label_drop { values = ["filename"] } |
Loki removing ingester failing healthcheck, pushes retried | Disk I/O starvation on a shared volume | Separate storage; check loki_write_dropped_entries_total stayed at 0 |
A for: 15m alert never fires on a flapping pod | The expression drops out and resets the timer | Shorten for, or alert on increase(restarts_total[30m]) which does not flap |
Sidecar dashboard returns Access denied for viewers | Imported without Viewer permission | Grant builtInRoles/Viewer on the dashboard, or provision into a folder with permissions |
| Memory-vs-limit division returns nothing | cAdvisor id/instance labels do not match kube-state-metrics’ | max by (namespace, pod, container) on both sides |
Running this in production
- Replace the
nullreceiver on day one. An alerting pipeline that ends innullis a dashboard with extra steps. - Move Loki to the scalable mode with object storage before the first cluster that matters; single-binary with a filesystem is a lab and a small-cluster shape.
- Drop the API server histogram buckets you will never query, and put a series-count alert on Prometheus
itself (
prometheus_tsdb_head_series); 76,000 series on an idle cluster becomes millions on a busy one. - Keep the label set for logs to the five above, and review
loki/api/v1/labelswhen a new team starts shipping; a new label is a permanent cost. - Give every workload a triage dashboard variable-driven by namespace and pod, so the first minute of an incident is the same for every service. The JSON above is a start.
- Pair this with the Kubernetes Operations path, which covers the same failures
from the
kubectlside, and with Logging, Audit and Security Visibility for the audit-log layer this stack does not collect.
References
- kube-prometheus-stack chart and prometheus-operator:
PrometheusRule - Prometheus: querying basics and alerting rules
- kube-state-metrics: pod metrics
- Loki Helm chart: deployment modes and label best practices
- Grafana Alloy:
loki.source.file,loki.process,discovery.kubernetes - LogQL
- Grafana: provisioning dashboards with the sidecar
- Tool profiles on this site: Prometheus, Grafana, Loki, OpenTelemetry
Keep reading